
The US stock market has delivered an average annual return of about 10% per year since 1926. But short-term results vary widely and in any given year stock returns can be positive, negative, or flat.
When setting expectations for your own investment portfolio, it’s helpful to understand the range of outcomes historically experienced by investors. For example, how often has the stock market’s annual return matched its long-term average?
Before we answer that question, let us reframe it using an example from the sports world, where NBA Superstar LeBron James is a perfect example. Over the course of his NBA career that spans 1,198 regular season games over 16 seasons, LeBron James has averaged 27 points per game, 7 rebounds per game, and 7 assists per game (27-7-7). These are impressive statistics and represent a superb average for any player throughout the history of professional basketball. Guess how many games LeBron James has played where he finished with exactly 27 points, 7 rebounds, and 7 assists?
If you guessed ZERO, then you would be correct, and you’re probably already seeing how this relates to investment returns.
Average stock market returns, just like average basketball statistics, can be very misleading. They represent long-term trends and are the statistical outcome of a wide-ranging set of results. The chart below shows the annual stock market returns for the S&P 500 from 1926 to 2018, with the grey zone marked to indicate the 10% average return range so that we can see just how often actual returns end up near the average.
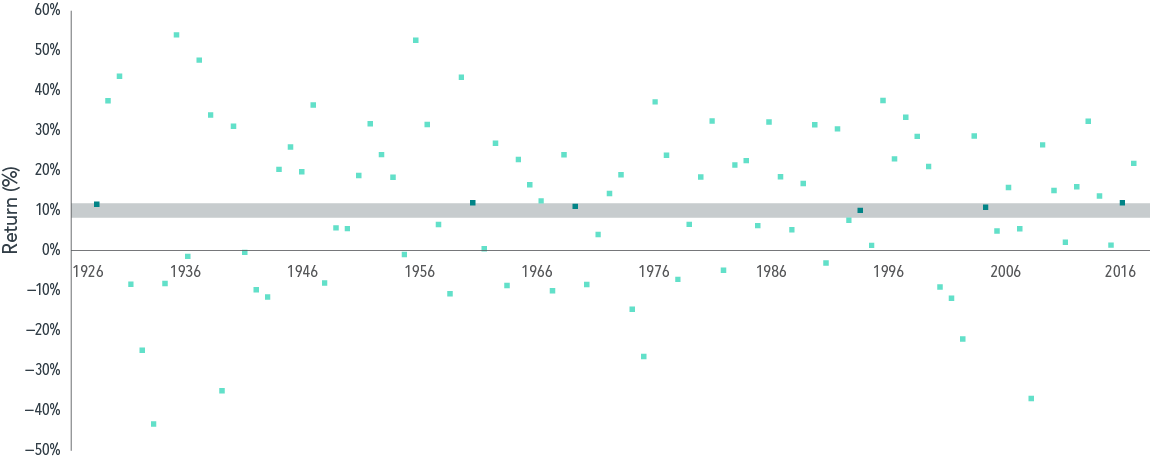
Only six years of the returns in the grey zone, which spans 92 years, falls within close range of the 10% average, and of those six years, only two years would actually be rounded to equal the 10% average return. So, two out of the past 92 years have exhibited average returns. In all the other years investors experienced returns ranging from a greater than 50% positive to greater than 40% negative return in the most extreme cases. As you can see from the chart above, an overwhelming majority of returns for the past 92 years have been clustered above zero.
The question arises, should you expect to have average returns on the stocks you own in any given year? No. You should expect that some years will bring slightly positive returns, some years slightly negative, and some years could see an extreme in either direction. Over the long-term, historically speaking, stocks have exhibited comfortably positive returns, and when they are included in a well-diversified portfolio that consists of more than just S&P 500 stocks, your portfolio should meet your long-term investment goals while taking the appropriate amount of risk. That would be a truly successful portfolio and should not be compared to an “average.”
Please let us know if we can help you determine if your portfolio is structured to meet your long-term goals.
CCMI provides personalized fee-only financial planning and investment management services to business owners, professionals, individuals and families in San Diego and throughout the country. CCMI has a team of CERTIFIED FINANCIAL PLANNERTM professionals who act as fiduciaries, which means our clients’ interests always come first.
How can we help you?